# What is Tradingview ?
### What is TradingView?
TradingView is a cloud-based platform for charting and analyzing financial markets. It provides real-time data and tools for traders and investors to visualize and interpret market trends, identify trading opportunities, and manage their portfolios.
TradingView offers a wide range of features, including customizable charting tools, technical indicators, drawing tools, and social networking capabilities. It covers a wide range of financial markets, including stocks, commodities, forex, and cryptocurrencies.
TradingView also has a large community of traders and investors who share their analysis, ideas, and trading strategies, making it a valuable resource for market participants of all levels. The platform is available through a web browser or mobile app and offers both free and paid subscription plans with varying features and levels of access .
{% hint style="info" %}
INFO
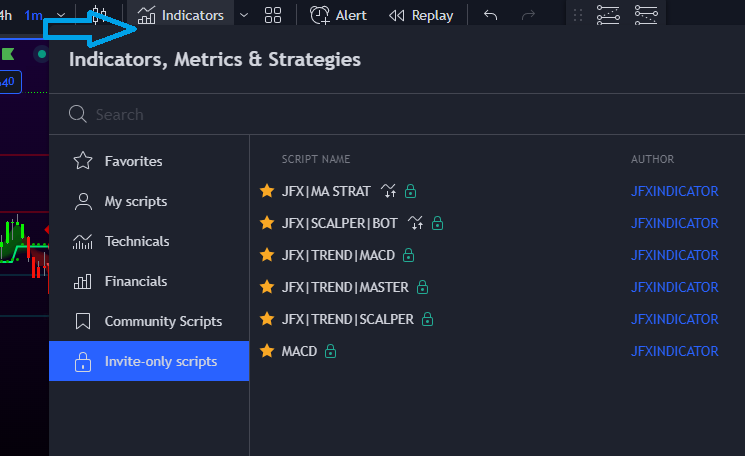
This is the great platform where we host our JFX INDICATOR indicator suite. You can create a free account on TradingView and then after signing up on [our website](https://jfxindicators.com) receive instant-access to use our products from your indicators folder under Invite only scripts.
{% endhint %}
### How To Create A TradingView Account
Creating a TradingView account is a simple process that can be completed in a few easy steps:
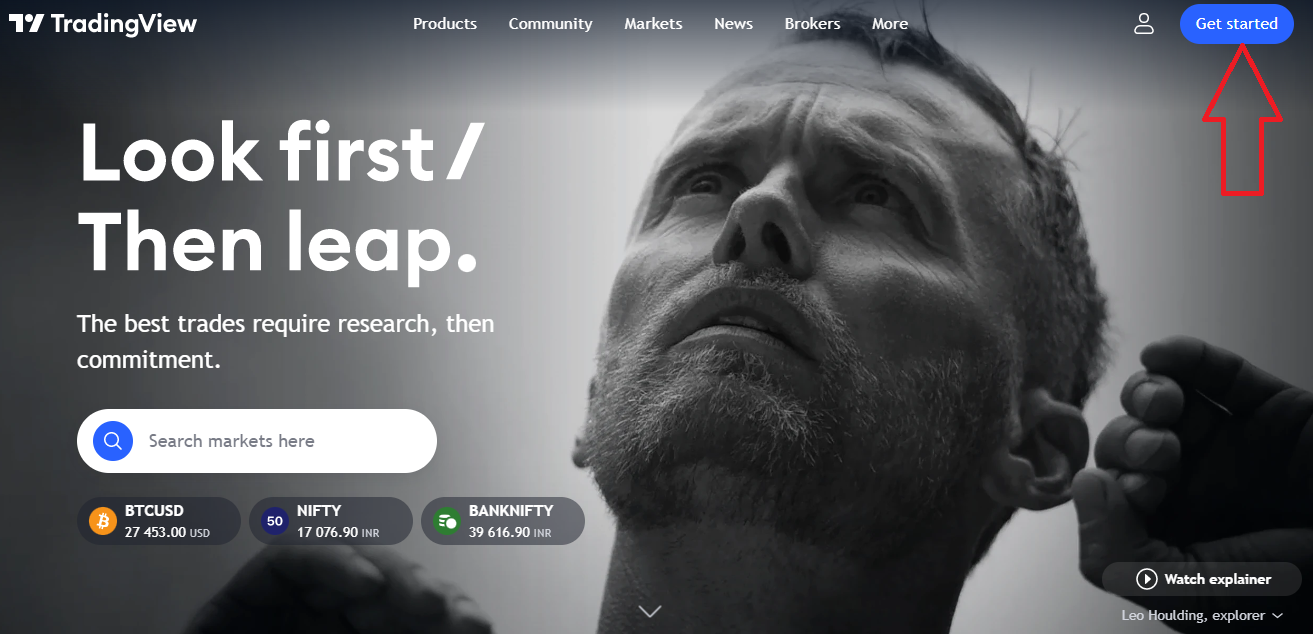
1. Go to the TradingView website ([www.tradingview.com](http://www.tradingview.com/)) on your web browser.
2. Click on the "Sign Up" button on the top right corner of the homepage.
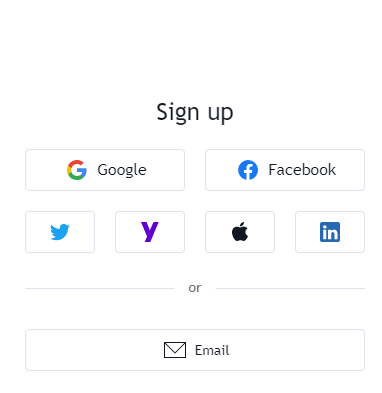
3. You will be prompted to choose between signing up with an email address or a social media account. Choose the option that suits you best.
4.
```
```
5. If you choose to sign up with an email address, enter your email address, create a password, and click on "Sign Up."
6. If you choose to sign up with a social media account, click on the social media platform you want to use, and follow the prompts to log in to your account.
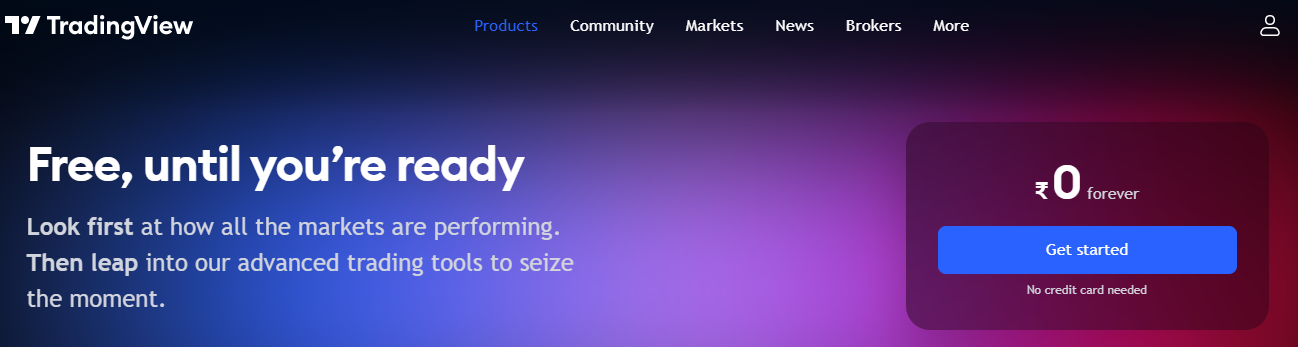
7. Once you have signed up, you will be prompted to select a subscription plan. TradingView offers both free and paid plans with varying features and levels of access. Choose the plan that suits your needs best.
8.
```
```
9. Complete the registration process by providing any additional information required.
10. Once you have completed the registration process, you can start using TradingView to analyze markets, create charts, and share your analysis with the TradingView community
## TRADINGVIEW CHARTS
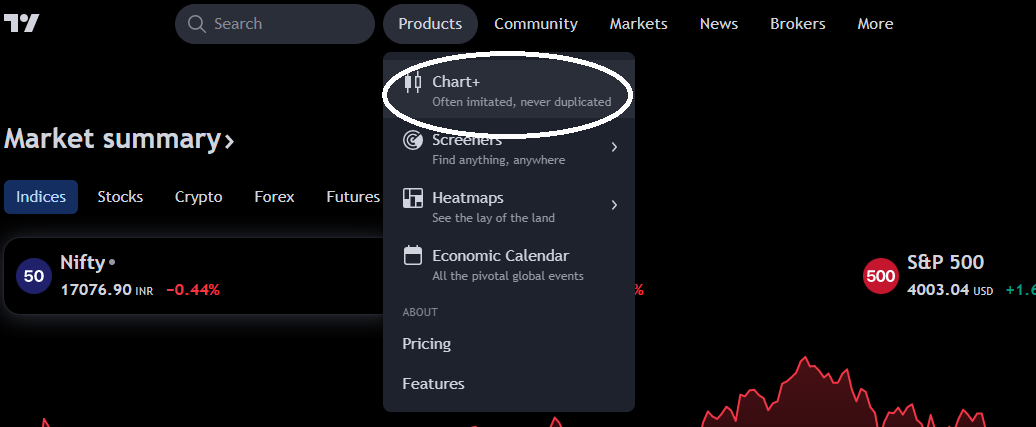
**How to open a chart on Tradingview**
You can open a chart on TradingView by clicking on 'Chart'.
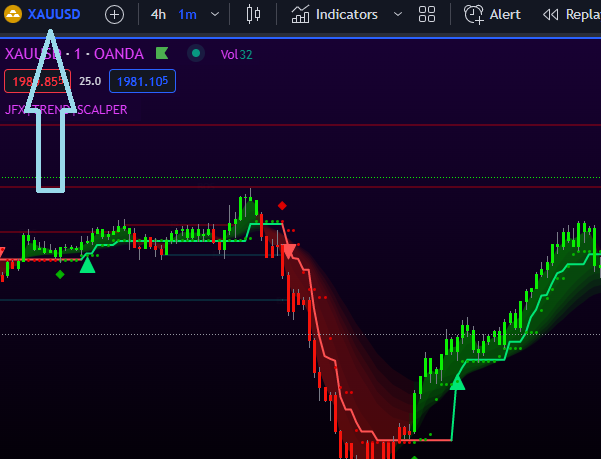
**How to change Symbol ?**
You can change the symbol of the chart by clicking on the top left section containing the current chart ticker.
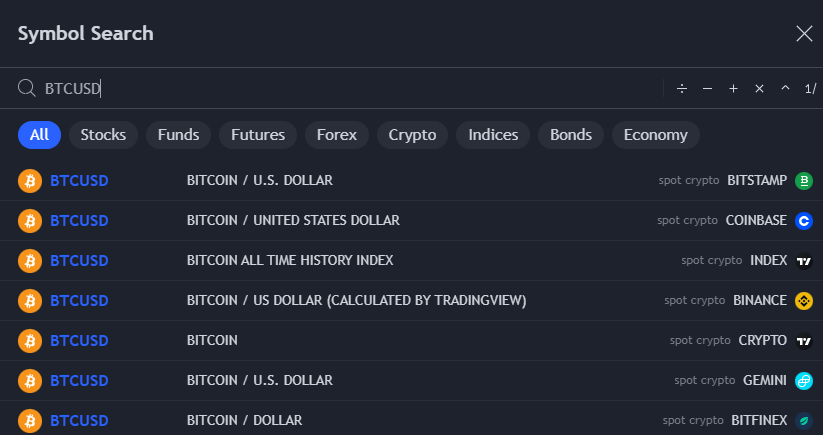
After clicking select the instrument you want to chart by typing the symbol or name of the asset
You can chart a wide range of financial instruments, including stocks, indices, forex pairs, cryptocurrencies, and more.
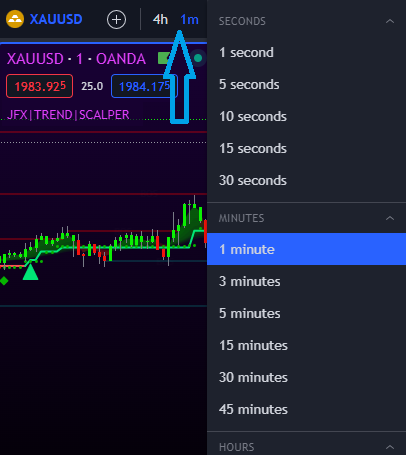
**Change Chart Time Frame**
Choose the time frame you want to view by clicking on the timeframe buttons at the top of the chart. You can also adjust the chart's settings by clicking on the gear icon in the upper right corner of the chart
{% hint style="info" %}
You can also type the timeframe directly on your keyboard to change it.
{% endhint %}
**Adding Indicators to the chart**
Click on the **Indicators** button at the top of the chart, this will open a menu, search for the indicator and click on it to add it to the chart.
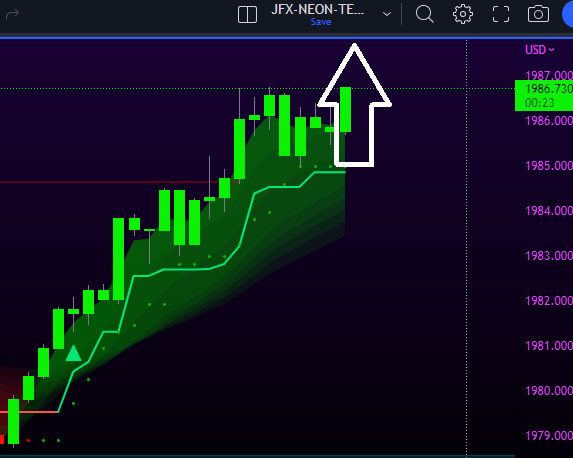
**Save a chart layout**
To save your chart, click on the "Save" button at the top of the page. You can also share your chart with others by clicking on the "Share" button and copying the link.